

OK, So What is UK Inflation Really?
OK, So What is UK Inflation Really?
Well past time to publish regional and/or wealth band inflation numbers

When an economy becomes riven by exceptionally large regional inequalities of earnings and wealth, it gets hard to calculate a ‘national’ inflation rate. There are two problems: big differences in income generate correspondingly different patterns of consumer spending. Typically, for example, you’d expect spending on food to be a larger part of a a family’s spending in a poorer part of the country. Added to that is the likelihood that prices of the same good or service will vary according to local earning and wealth conditions.
In other words, in a country of exceptional income inequalities, what people spend their money on will vary from region to region, and so will the prices they are charged for the same product or service.
In these circumstances, a ‘national’ inflation rate becomes an unreliable economic guide, which in turn will generate unreliable policy responses. Some countries acknowledge the problem by calculating separate inflation rates for different parts of the country. In the US, for example, the CPI which hits the headlines is actually the CPI for urban consumers, and different parts of the country. Thus, in the US, the CPI rose 3.7% yoy, but look closer and you’ll find it was 4.1% for the South, 3.9% for the West, 3.4% for the Midwest and 2.8% for the Northeast. Quite different ‘inflation problem’ is showing in the South than in the Northeast.
Other economies, where income disparities are very large, calculate CPIs for different income bands. In Hong Kong, for example, the average monthly spend for about half the population is HK$6,700 to $28,700, and for them the relevant inflation rate is calculated as CPI-A. But there is also CPI-B ($28700 to $49,600 monthly spend), and CPI-C ($49,600 -94,200 monthly spend). Hong Kong’s headline inflation rate is the Composite CPI using a weighted average of these three different indexes.
Now, there is no doubt at all that the UK regional inequalities are big enough to cast doubt on ‘national’ CPI numbers. There seems no reason to expect that the spending patterns in Central London (income: Camden £63,854, Kensington & Chelsea £64,660, Westminster £67,389) should resemble even remotely what gets spent in Leicester (income: £14,605), or the 22 other identifiable local govt regions where the h’hold income is under £17,000.
What we do know is that prices for similar goods and services vary hugely from region to region. From time to time the ONS investigates these differences. But not very often: results are published for 2000, 2010 and 2016, and nothing since then. Still, let have a look.
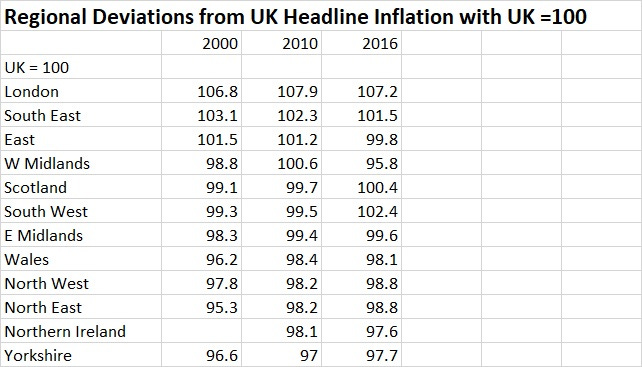
A quick explanation about what you are seeing in this table. In each year, the national CPI is indexed at 100, and the same basket of goods is then priced in each region. So, for example, in 2016, a basket of goods & services costing £100 on average in the UK is found to cost £107.2 in London and £97.6 in Northern Ireland. That means Londoners are being charged 9.8% more than Ulsterman for the same goods & services.
When we compare London’s prices with the average of the rest of the country, in 2016, London’s prices were 3.8 standard deviations above the national average. That standard deviation varies: in 2000 it was 2.9SDs, in 2010 it was 5.1SDs (!!). However, these sorts of standard deviations tell us quite plainly that London is a different economy in terms of price dynamics.
This is not the merely technical problem it may seem. Interest rates don’t vary between regions, and are the sole blunt instrument with which inflation is ‘brought under control’. But if we do not know (or care) about the extent of regional inflation a single interest rate may generate radically different economic outcomes in different parts of the country. For example, image that the national CPI reported at 5%, but inflation in London is running at 8% but only 2% in Leicester. An interest rate set to curb London’s inflation would (further) crucify Leicester. We need to know not just what the average inflation rate is, but how it varies and which regions are the source of the inflation.
Today, the ONS published CPI data claiming a national average of 6.7%, and later this week the Bank of England will make an interest rate decision partly based on that. I wonder what the inflation rate is in London, and how it is moving? I wonder what it is in Leicester, and how it is evolving?
What would be the appropriate response? If - and I do not know or claim this is the case - ‘national’ inflation is being generated primarily in London, it would seem right to consider some sort of protection for Leicester et al from the impact of rising interest rates?
This raises issues about subsidies, which seem an impossible interference with the working of the economy. I share those objections. But at the same time, let us remember that a far more iniquitous regime of subsidies is already at play. It’s just that those subsidies are called ‘London weighting’, and they involve taxing Leicester to pay subsidies to offset the impact London’s inflation. Is it possible to envisage a greater unfairness: taxing the poorest to subsidize the richest, and, whilst you are doing so, encouraging a London inflation rate which will be countered by higher interest rates, and higher real interest rates, in Leicester than London? Outside the taxation system of the Ancient Regime in pre-Revolutionary France, I cannot imagine a grosser established injustice.
I had always presumed that the Bank took these variations into effect, gathering its information through its network of “agents”, whoever they are.
If they’re not then it’s…pretty stupid, surely?