

Is the UK Still a 'Coherent Sample'?
Is the UK Still a 'Coherent Sample'?
Just about, yes. But it's a close call.

Is the British economy still a ‘coherent sample'? Although it sounds an odd, perhaps incomprehensible question, I think there is probably the most important one we can ask about Britain right now. Explanations are in order: theoretical and practical.
Explanation 1. There are several great regularities which show up time after time in economics and statistics. One of these is something called the Zipf distribution, which links the size of something to the frequency with which it is found. For example, in a language, there are a small number of words used very frequently (eg: ‘and’, ‘the’, ‘is’ etc) and a very large number of words you come across only very rarely (eg: Zipf, logarithmic etc). The relationship between the frequency and the number of words is strictly logarithmic. In chart terms, you can draw a straight log-line between the frequency with which a word is found, and the number of words showing that frequency. This works for every known language. If it doesn’t, what you are reading is not a coherent sample, or, in straightfoward terms, it’s not a single language.
This same Zipfian distribution is found time and again in economic data, particularly in economic geography. So, for example, the distribution of cities & towns by size and frequency within almost every country is demonstrably Zipfian. (Interestingly, the one big exception is . . . the UK, where London is far too big for the rest of Britain, and makes sense primarily as the capital of Europe). Zipfian distributions show up company profits or returns.
Zipfian distributions are also expected, and usually found, in the frequency of income levels found in a developed economy.
In what sort of economy would this Zipfian distribution fail? Well, most obviously in slave economies and/or gangster economies or kleptocracies.
Explanation 2. Quite apart from any moral judgements about inequality, the question of whether the UK is still a coherent sample matters in practical terms because if it fails this test, it raises the question of whether any single economic policy could ever be appropriate and/or effective.
In an economy, the sample is coherent when the commercial and financial decisions made in one part of the economy ultimately ramify throughout the rest of the economy. This is most easily seen in banking illustration: if there is a coherent national banking system, then deposits made in, say, Kensington will ultimately, through a potentially vast and untraceable web of decisions, make some difference to decisions made in Hartlepool. But if the banking system in Kensington is entirely separated from that serving Hartlepool, then deposits made in Kensington could make no difference to anything in Hartlepool.
This, then, is the threat: if the UK is no longer a coherent sample, there is no reason to expect that there are ‘correct’ decisions to be made on interest rates, currencies, levels of taxation or spending, infrastructure, and even ownership structures.
No government, no matter how smart, how competent, how armed with an effective administrative engine (ok, we’re dreaming here), could get policy ‘right’, because . . . the sample is not coherent.
The Result
That’s what’s at stake. Yesterday, the ONS published the data for regional gross disposable household income, UK: 1997 to 2021. Here you can find the dataset on which this is based. At its finest grain of detail, it breaks down the UK into 160 separate locations, and gives the gross per capita household income for each of those locations.
To generate the chart below, I divided those incomes in £500 tranches, starting at the bottom with Leicester at £14,605, and working all the way up to Westminster at £67,389. And then I counted the frequency within which places were located in those tranches. Here’s what it looks like:
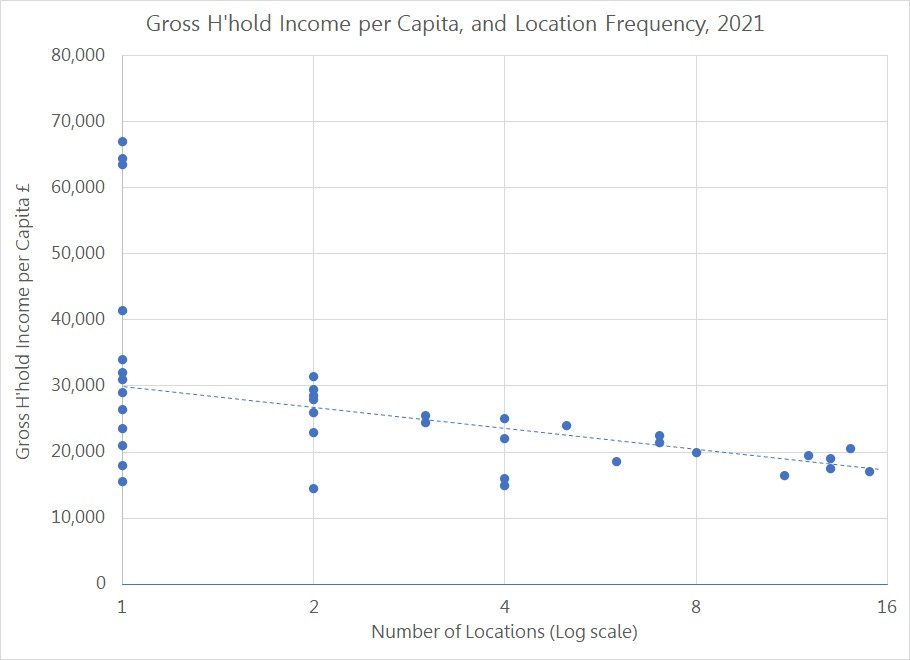
The good news is that despite very wide regional inequalities, for the most part, Britain is still, just about, hangs together as a coherent sample. Economic policies for the country as a whole are still, probably, possible. There are obvious exceptions: at the top, Camden/City; Kensington & Chelsea and Hammersmith & Fulham, and Westminster do not belong in the sample. But we already knew that.
More worrying is the cluster at the bottom. There are 11 locations which are borderline, where it’s not absolutely clear that they are participating in the same UK economy as the rest of us. These are: Leicester, Sandwell, Nottingham, Blackburn, Kingston on Hull, Stoke-on-Trent, Bradford, Wolverhampton, East Lancashire, Walsall and (even) Birmingham. It is plainly in the national interest that action is taken to keep these locations in ‘coherent sample’ territory.
(Happy to find that Hartlepool, regularly my go-to for deprivation, is safely in ‘coherent’ territory. Apologies, to Hartlepool, then: in future, Leicester will have that role. )
Is London a coherent sample?
Here I have only 17 distinct locations to deal with, not enough to allow the log scale of frequency used on the 160 sample for the UK as a whole. Still, even this reduced sample shows us that fairly obviously London does not hang together as a coherent sample. Who knew? There are two clear Londons as far as per capita household income is concerned: there is the London of Camden & City, Kensington & Chelsea, Hammersmith & Fulham, Westminster and, perhaps, Wandsworth, averaging £59,371 per capita. And then there’s the rest, with average h’hold income averaging slightly less than half that, at £27,500 per capita.
As someone said, if you are in London, you are either rich, or getting poorer fast.
Wandsworth appropriately straddles the divide: not quite rich enough to join the West London enclave, and South of the River.
